Use D3.js to display data
Winning entry
Graph Visualization & Topic Modeling
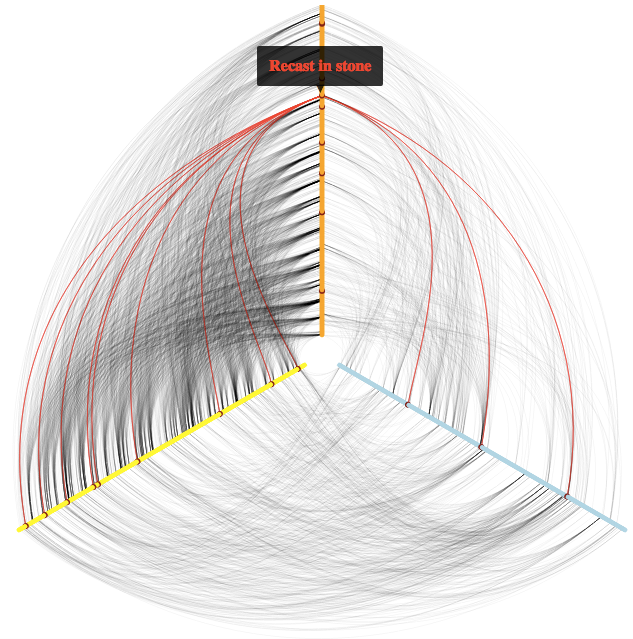
The winning entry shows displays the output from a modified Latent Dirichlet Allocation (LDA) model run on articles scraped from various politically polar publications. Topic models were obtained as a result of LDA modeling. A graph was constructed using the correlations of topic assignments as edge weights. The picture below shows a snapshot of this graph.
Check out the interactive demo and the corresponding GitHub repository.
This D3.js visualization has three features:
- Hive plot display of 3 publications (From 12:00, clockwise: Economist, Jacobin, WND) with links if a topicmodel correlation between documents is > 0.95.
- Clicking on a hive plot node will show in a separate panel that node and all connected nodes.
- Clicking on a node in the graph panel will open the article in a new page.
Other entries
- Dataframe Visualization (Demo, GitHub)
- Game of Life (Demo, GitHub)